The National Certificate of Educational Achievement (NCEA) is the main qualification for secondary school students in New Zealand. The way NCEAs are achieved has changed over time.
In this paper we look at six indicators that unpack how NCEAs are achieved:
- overall attainment
- certificate endorsements
- average number of credits assessed
- types of standards assessed, and
- grade distribution profiles for achievement standards.
We look at what differences exist when an indicator is disaggregated according to the socio-economic barriers to attainment students face.
Three groups are used (more, moderate, and fewer barriers).
Only 2023 data is presented.
On this page
What is NCEA?
The three National Certificates of Educational Achievement (NCEAs) are designed to recognise the general achievement of 16 to 19 year old learners. They are the main senior secondary schooling qualifications in New Zealand. Most commonly, students work through NCEA Levels 1 to 3 in years 11 to 13 at school.
NCEA Levels 2 and 3 open doors to tertiary study and training and employment. NCEA Level 3 with University Entrance is the minimum requirement to go from school to a New Zealand university.
Both achievement standards and unit standards registered on the New Zealand Qualifications and Credentials Framework can contribute credit toward NCEAs.
What policy settings have changed since 2008 that affect NCEA?
2008
Certificate endorsement introduced.
2011-2013
Standards Realignment. This review of assessment standards was designed to improve alignment of NCEA Level 1, 2 and 3 to their respective curriculum levels 6, 7 and 8 (decreasing unit standards available, increasing achievement standards available (particularly internally assessed achievement standards), and increasing the range of standards available to assess the literacy and numeracy requirements of NCEA.
2011
Course Endorsement introduced.
2014
Change to University Entrance requirements.
2020-2022
A number of time-limited changes were made to the NCEA and University Entrance award criteria to recognise the disruptions to teaching, learning and assessment from COVID-19.
2021-2023
NCEA pilots.
2024
NCEA Co-requisite implemented and new NCEA L1 achievement standards implemented
Notes on the data
NZQA’s enrolment-based cohort of students is used in this analysis. It includes all New Zealand domestic students in Years 11 to 13 with a Ministry of Education enrolment of one day or more regardless of whether they are working towards any of the NCEA qualifications. When referring to this cohort, the term ‘senior secondary students’ is used. In 2023, there were 175,244 senior secondary students. Reporting using this cohort is available for the 2008 to 2023 period, i.e. the last 16 years.
In 2020, 2021, and 2022 teaching, learning and assessment were disrupted by the COVID-19 pandemic. To recognise the disruptions, changes were made to the award criteria for NCEA and University Entrance.
Indicator 1: Overall attainment
NCEA attainment for senior secondary students in 2023 is higher than it was in 2008, however there are different trend patterns by level. Furthermore, mitigations applied to the award criteria for NCEA and UE to support students during the covid-19 years (2020, 2021, and 2022) impacted on attainment rates.
Figure 1: Enrolment-based attainment rates of Year 11 to 13 students attaining NCEA Levels 1-3 and University Entrance, 2008 to 2023
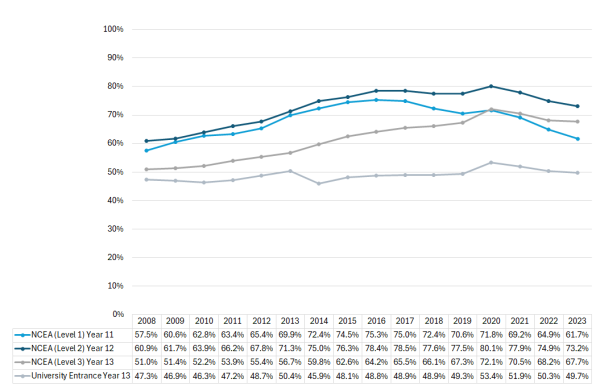
Year 11 NCEA Level 1 attainment increased between 2008 and 2016 but has shown a declining trend since then. In 2019, the NCEA Review changes confirmed NCEA Level 1 as an optional level for schools who want to continue to use this qualification. Since 2017, we have seen the proportion of Year 11 students engaging with NCEA Level 1 decline, thus impacting on the attainment rate of this qualification by Year 11 students.
Year 12 Level 2 attainment increased between 2008 and 2016, and has shown a downward trend since then although not as sharp as for Year 11 Level 1.
Year 13 Level 3 attainment increased steadily between 2008 and 2019, and in 2023 is at a similar level to 2019, the last year unaffected by COVID-19 related disruptions.
Year 13 University Entrance attainment has remained reasonably steady since 2008, particularly in comparison to Year 13 NCEA Level 3.
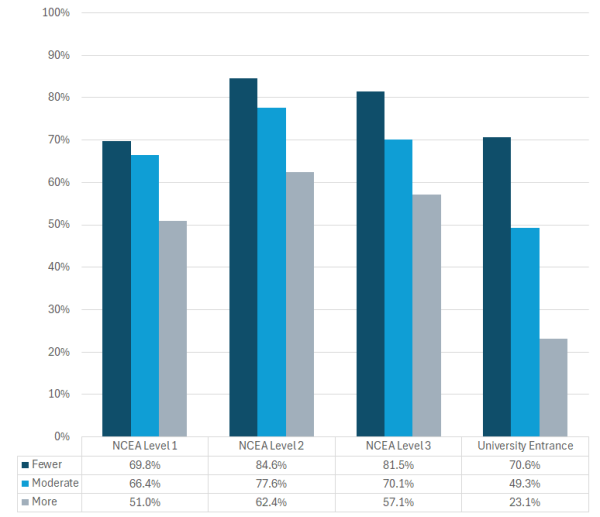
As shown in Figure 2, 2023 attainment rates are lower for the group of schools with students that face more socio-economic barriers to attainment.
Figure 2: Enrolment-based attainment rates of Year 11 to 13 students attaining NCEA Levels 1-3 and University Entrance, by socio-economic barriers to attainment (school equity index group), 2023
Indicator 2: Certificate endorsements
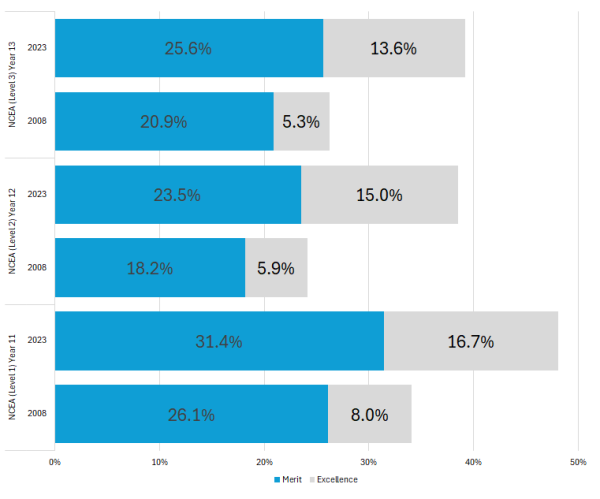
NCEA Certificate endorsement recognises the achievement of students who perform consistently above the Achieved level by endorsing their NCEA Certificate at either Merit or Excellence. Between 2008 and 2023 the proportion of NCEA certificates endorsed with merit or excellence has increased across all three levels. The rate of excellence endorsements increased more than the rate of merit endorsements at all three levels.
Figure 3: Certificate endorsement rates of Year 11 to 13 students attaining NCEA Levels 1-3, 2008 and 2023
Indicator 3: Average number of credits assessed
When comparing 2008 to 2023, there has been a decrease in the average number of credits assessed for Year 12 students who achieved NCEA Level 2 and Year 13 students who achieved NCEA Level 3. The year-on-year trend over this period shows a steady decrease.
Table 1: Average number of credits assessed for Year 12 NCEA Level 2 achievers and Year 13 students NCEA Level 3 achievers, 2008 and 2023
| Year | Average credits assessed, Year 12 Achieved | Average credits assessed, Year 13 Achieved |
| 2008 | 121 | 108 |
| 2023 | 107 | 96 |
The average credits assessed figures are lower for students in schools with more socio-economic barriers to attainment. The table below provides the average credits assessed for Year 12 students in 2023.
Table 2: Average number of credits assessed for Year 12 NCEA Level 2 achievers by socio-economic barriers to attainment (school equity index group), 2023
| School Equity Index Group |
Average credits assessed, Year 12 Achieved Level 2 |
| More | 102 |
| Moderate | 107 |
| Fewer | 112 |
Indicator 4: Students assessed in four or more courses who achieved NCEA
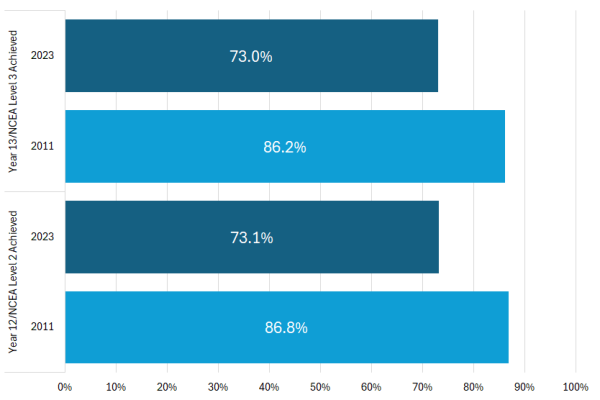
The proportion of students being assessed in four or more courses of at least 14 credits each is a measure of the breadth and depth of NCEAs achieved. Schools determine the content of courses and the standards used to assess the teaching and learning outcomes of each course. NZQA started monitoring courses attempted and assessed in 2011 when course endorsement was introduced. The proportion of Year 12 and Year 13 students who achieve NCEA, and are assessed in four or more courses, has decreased since 2011.
Figure 4: Proportion of Year 12 Level 2 Achievers, and Year 13 Level 3 achievers who were assessed in four or more courses, 2011 and 2023
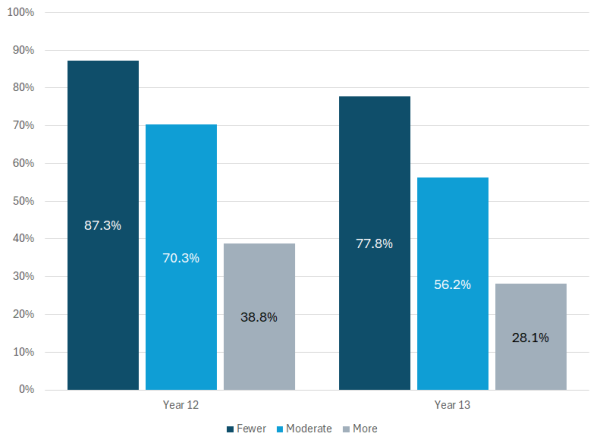
The proportion of Year 12 Level 2 Achievers, and Year 13 Level 3 achievers who were assessed in four or more courses is lower for students in schools with more socio-economic barriers to attainment.
Figure 5: Proportion of Year 12 Level 2 Achievers, and Year 13 Level 3 achievers who were assessed in four or more courses by socio-economic barriers to attainment (school equity index group), 2023
Indicator 5: Types of standards assessed
It is common for assessment programmes to be made up of a mix of unit standards and achievement standards (internally and externally assessed). Figures 6 and 7 show the proportion of results by standard type since 2008. The effect of the Standards Realignment project is noticeable between 2011 and 2012 for Level 2 standards (increase in the proportion of results from internally assessed achievement standards), and between 2012 and 2013 for Level 3 standards (increase in the proportion of results from internally assessed achievement standards).
Since 2012, there has been a steady decrease in the proportion of results from externally assessed achievement standards for Year 12 Level 2 achievers. Between 2013 and 2020, there was a steady decrease in the proportion of results from externally assessed achievement standards for Year 13 Level 3 achievers. This has since stabilised at 22%.
Figure 6: Proportion of results by standard type for Year 12 Level 2 Achievers, 2008-2023
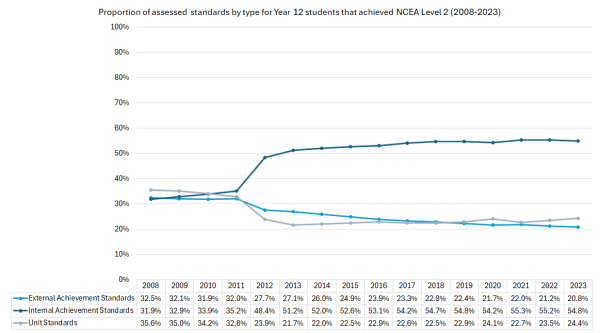
Figure 7: Proportion of results by standard type for Year 13 Level 3 Achievers, 2008-2023
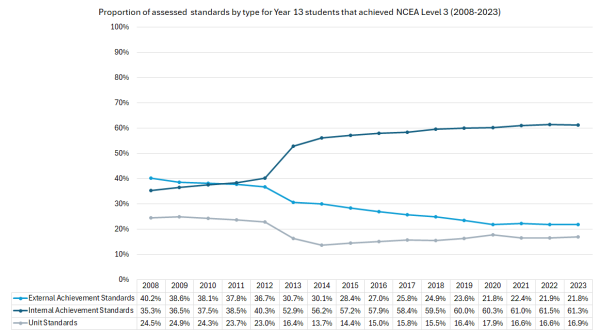
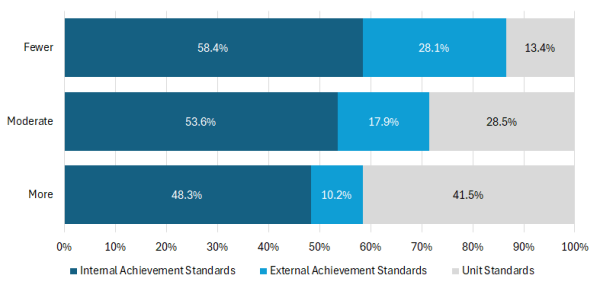
The proportion of results by type differs when looking at schools by socio-economic barriers to attainment (school equity index group). Schools in the more socio-economic barriers to attainment group have a higher proportion of unit standard results and a lower proportion of externally assessed achievement standard results. Figure 8 below shows this for Year 12 Level 2 achievers.
Figure 8: Proportion of results by type for Year 12 Level 2 Achievers, by socio-economic barriers to attainment, 2023
Indicator 6: Grade distribution profiles for achievement standards
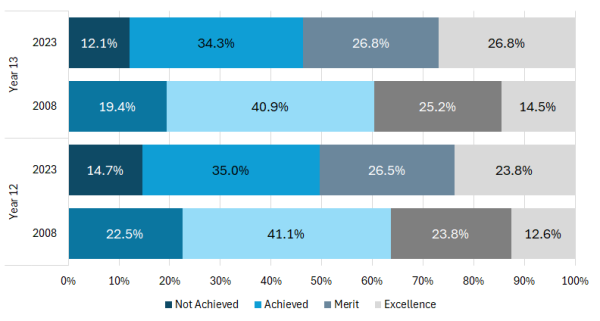
Achievement standard grade distribution profiles for Year 12 and Year 13 students who achieved NCEA Level 2 or 3 respectively, have changed over time. Students receive Not Achieved, Achieved, Merit or Excellence grades for achievement standards. Comparing 2008 to 2023, not achieved rates have decreased and excellence rates have increased. Over the 2012-2023 period, most achievement standards have not had any significant changes or revisions.
Figure 9: Grade distribution of achievement standards for Year 12 and Year 13 students, 2008 – 2023
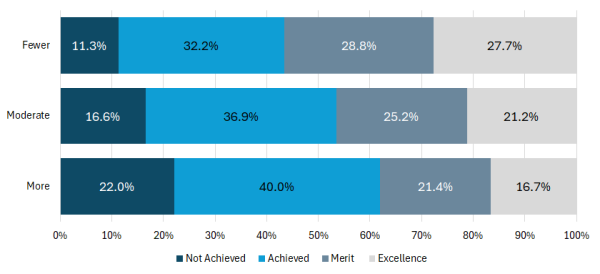
The grade distribution for achievement standards Year 12 and Year 13 students differs when looking at schools by socio-economic barriers to attainment (school equity index group). Schools in the fewer socio-economic barriers to attainment group have a lower proportion of not achieved results and a higher proportion of excellence results. Figure 10 below illustrates this for Year 12 students who achieved NCEA L2.
Figure 10: Grade distribution of achievement standards for Year 12 NCEA L2 achievers, by socio-economic barriers to attainment (school equity index group), 2023
Conclusion
Across all 6 key indicators, we observe that changes in how NCEAs are achieved have occurred over time.
Indicator 1 – Overall attainment
NCEA attainment for senior secondary students in 2023 is higher than it was in 2008, however there are different trend patterns by level. Year 11 NCEA Level 1 attainment is showing a declining trend in more recent years as the proportion of Year 11 students engaging with NCEA Level 1 declines.
Indicator 2 – Certificate endorsements
Over time the proportion of NCEA certificates endorsed with merit or excellence has increased across all three levels.
Indicator 3 – Average number of credits assessed
There has been a decrease in the average number of credits assessed for Year 12 Level 2 achievers and Year 13 Level 3 achievers over time.
Indicator 4 – Students assessed in four or more courses who achieved NCEA
This is an indicator of breadth and depth of NCEAs achieved. The proportion of Year 12 and Year 13 students who achieve NCEA and are assessed in four or more courses has decreased since 2011, from 86% to 73%.
Indicator 5 – Types of standards assessed - Year 12 and Year 13 students
Since 2012, there has been a steady decrease in the proportion of results from externally assessed achievement standards for Year 12 Level 2 achievers. Between 2013 and 2020, there was a steady decrease in the proportion of results from externally assessed achievement standards for Year 13 Level 3 achievers. This has since stabilised at 22%.
Indicator 6 – Grade distribution profiles for achievement standards
Over time, achievement standard not achieved rates have decreased and excellence rates have increased. Over the 2012-2023 period, most achievement standards have not had any significant changes or revisions.
There were some adjustments to qualification settings since 2008 which will have affected some of the indicators, particularly in the 2008-2014 period. Disruptions due to COVID-19 and the application of mitigations in 2020, 2021 and 2022 affected all the indicators.
Across all 6 key indicators, the 2023 analysis by socio-economic barriers to attainment (school equity index group) shows that the standards that are assessed and the way NCEAs are achieved differs depending on the school equity index group.

